
1 страниц (8 вхождений)
Problem with Graphs - graph of the resultant bending moment - Сообщения

I was stuck in a ragged moment. I don't know how to draw a graph. Finally, a correct chart made in Excel.
248. proba do wyslania.sm (23,67 КиБ) скачан 1157 раз(а).
248. proba do wyslania.sm (23,67 КиБ) скачан 1157 раз(а).
WroteI was stuck in a ragged moment. I don't know how to draw a graph. Finally, a correct chart made in Excel.
You didn't define a, P, P.o, P.r, D.k.
After them defined with a number, a graph can appear.
Regards
Sorry I didn't save before posting.
That's right now.
I have problems with ]the Mg1 (x) and Mg2 (x) graph, this one at the end.
proba do wyslania.sm (50,09 КиБ) скачан 1196 раз(а).
That's right now.
I have problems with ]the Mg1 (x) and Mg2 (x) graph, this one at the end.
proba do wyslania.sm (50,09 КиБ) скачан 1196 раз(а).
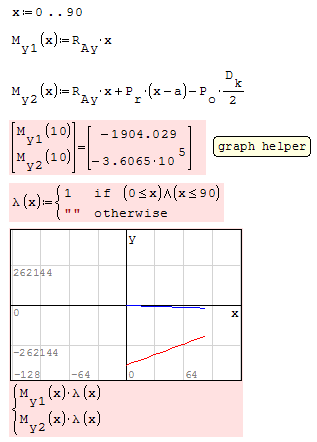
WroteI have problems with ]the Mg1 (x) and Mg2 (x) graph, this one at the end.
If I understood correctly, you are trying to plot graph picture in your file.
Here it is, you can download and check it from file below.
Regards
proba do wyslania.sm (46,79 КиБ) скачан 1178 раз(а).
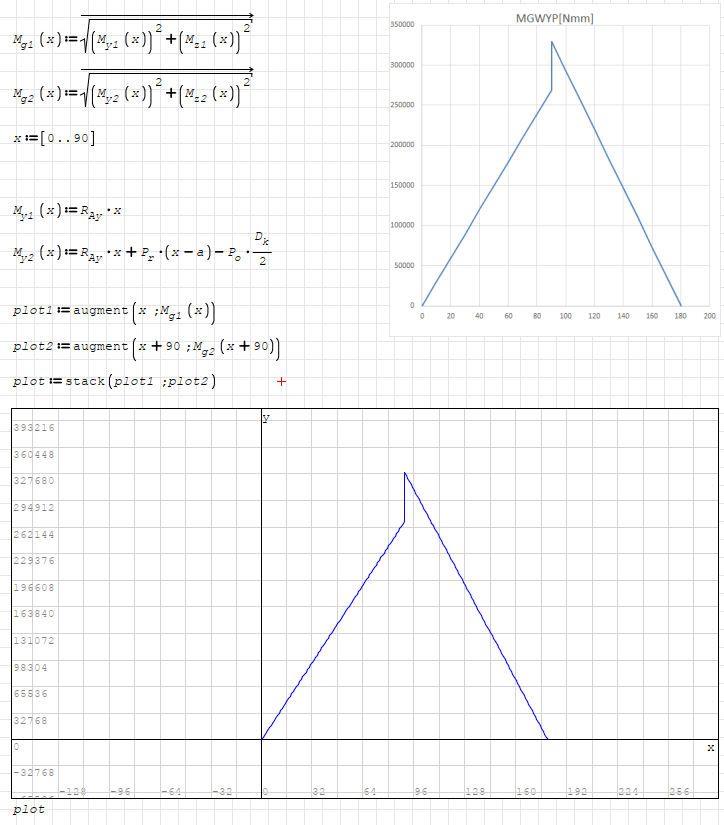
... for convenience: cumulative integration added.
proba do wyslania (1).sm (59,29 КиБ) скачан 1156 раз(а).
proba do wyslania (1).sm (59,29 КиБ) скачан 1156 раз(а).
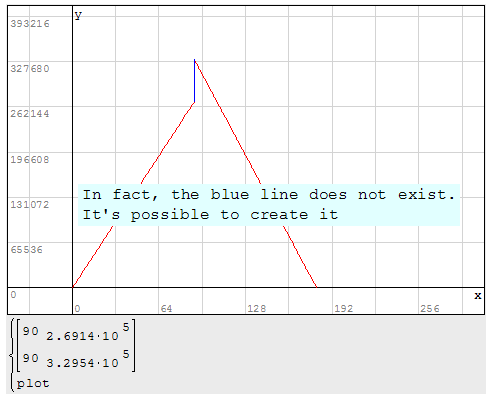
Actually you don't need stack, augment, vectorize, etc.
It can also be plotted easily like this.
Regards
proba do wyslania.sm (45,61 КиБ) скачан 1173 раз(а).

It can also be plotted easily like this.
Regards
proba do wyslania.sm (45,61 КиБ) скачан 1173 раз(а).
1 страниц (8 вхождений)
- Новые сообщения
- Нет новых сообщений